Portfolio Lab research · Updated 11 September 2026 · 7 min read
Bullish on Bitcoin? Test Conviction and Position Size Separately
You can have a strong Bitcoin thesis while giving different parts of your savings different jobs.
Start with the retirement income you want
Imagine that you want to retire at a particular age with enough income to maintain your way of life. Some of that income might come from a pension. Your investments need to provide the rest, potentially for several decades, while helping your spending keep pace with rising prices.
That gives your portfolio two jobs. Before retirement, it needs to grow towards the amount you will need. During retirement, it needs to support withdrawals for everyday life. You might also need money along the way for a house deposit, a career break or an unexpected expense.
A retirement plan therefore needs both an income target and a withdrawal strategy: how much of your savings you intend to spend each year, and how you would adjust if circumstances change. A withdrawal rate is the amount taken out over a year, expressed as a percentage of the portfolio. Whether that rate is sustainable depends on factors including how long retirement lasts, inflation, investment returns and the timing of market falls.
If you expect Bitcoin to grow strongly over the long term, you may want it to play a substantial part in that plan. But an optimistic view of its future does not, by itself, tell you how much to hold or how to fund retirement income during a difficult market.
In this article, we explore one part of that decision. We compare different amounts invested in Bitcoin under two assumptions about its future growth, then show what happens to each portfolio in two clearly defined market falls. The purpose is to help you ask whether a particular allocation could support your plan. These comparisons do not calculate the Bitcoin allocation needed to meet a specific retirement-income target or establish a safe withdrawal rate.
Two percentages that answer different questions
The first percentage is the share of your portfolio invested in Bitcoin. For example, a 5% allocation means that 5 out of every 100 units of your invested savings are in Bitcoin. The other 95 are invested elsewhere.
The second percentage is the annual growth we assume for Bitcoin itself. We tested compound annual growth rates of 15% and 30%. Compounding means that growth builds on earlier growth over time. These are assumptions used to explore different futures, not promises that Bitcoin will deliver those returns or grow steadily each year.
We began with a portfolio containing 60% global shares, 30% US aggregate bonds and 10% cash. To make room for Bitcoin, we reduced each of those three holdings in the same proportion. A portfolio with 5% invested in Bitcoin therefore holds 57% in shares, 28.5% in bonds and 9.5% in cash.
All return calculations in this example are measured in US dollars. Portfolio Lab supports five investor currencies, but this table uses one currency consistently so the comparison is clear. Returns measured in your own spending currency can differ.
Read the table in two steps. First choose a row to see how much of the portfolio is invested in Bitcoin. Then choose a column for the growth assumed for Bitcoin. The number where they meet is the modelled annual compound return of the whole portfolio, including shares, bonds and cash.
| Share of portfolio invested in Bitcoin | If Bitcoin grows at 15% a year | If Bitcoin grows at 30% a year |
|---|---|---|
| 0% | 6.23% | 6.23% |
| 1% | 6.38% | 6.52% |
| 5% | 6.95% | 7.67% |
| 10% | 7.64% | 9.08% |
| 20% | 8.90% | 11.80% |
Take the row with 5% of the portfolio invested in Bitcoin. If Bitcoin’s assumed annual compound growth is 15%, the model estimates that the whole portfolio grows at 6.95% a year. If we raise Bitcoin’s assumed growth to 30%, while keeping its allocation at the same 5%, the estimate for the whole portfolio rises to 7.67% a year.
Now look at the row with 20% of the portfolio invested in Bitcoin. Under the same two Bitcoin growth assumptions, the whole-portfolio estimates are 8.90% and 11.80% a year respectively. A larger Bitcoin holding makes the portfolio more sensitive to how Bitcoin performs.
For someone saving for retirement, higher growth could help build the required savings sooner. But these figures alone cannot tell us whether the goal is achievable. We would also need the starting savings, future contributions, retirement date and income requirement, followed by a test of withdrawals across different possible market paths.
What if markets fall before you need the money?
Long-term growth estimates can hide the experience along the way. To make that experience more concrete, we separately tested two hypothetical market falls. We use “shock” simply to mean a specified change in prices, applied to the starting portfolio before any rebalancing or withdrawals.
Scenario 1: Bitcoin falls on its own. Bitcoin’s price falls by 70%, while the values of shares, bonds and cash stay unchanged. This isolates the effect of the Bitcoin holding.
Scenario 2: Bitcoin, shares and bonds fall together. Bitcoin falls by 70%, shares by 20% and bonds by 10%. Cash stays unchanged. This shows how losses elsewhere in the portfolio can add to the fall in Bitcoin.
These are deliberately specified examples. We have not assigned either a probability, predicted when it might happen or claimed that it is the worst possible outcome. They are separate from the annual growth assumptions above: the shock results are the same whether we assume Bitcoin compounds at 15% or 30% over the long term.
| Share of portfolio invested in Bitcoin | Scenario 1: Bitcoin −70%; other holdings unchanged | Scenario 2: Bitcoin −70%, shares −20%, bonds −10%; cash unchanged |
|---|---|---|
| 0% | 0.00% | -15.00% |
| 1% | -0.70% | -15.55% |
| 5% | -3.50% | -17.75% |
| 10% | -7.00% | -20.50% |
| 20% | -14.00% | -26.00% |
For example, suppose the portfolio starts at US$100,000, with 5% invested in Bitcoin. The Bitcoin holding is worth US$5,000. In Scenario 1, a 70% fall in that holding reduces its value by US$3,500. Because everything else stays unchanged, the whole portfolio falls by 3.5%, to US$96,500.
In Scenario 2, that same portfolio also loses value in its share and bond holdings. The total fall is 17.75%, or US$17,750, leaving US$82,250. This is why looking only at the Bitcoin holding would give an incomplete picture of this particular market fall.
Bring the comparison back to retirement
Volatility describes how widely returns vary; it is not the same as permanent loss. A fall in market value can be temporary, although recovery is never assured. For someone drawing retirement income, the practical question is whether they would need to sell investments after a fall to pay the bills.
Selling more investments at lower prices to maintain the same income leaves fewer invested for a possible recovery. That is why a portfolio’s average growth rate is not enough to establish a sustainable withdrawal rate. The order in which good and bad years arrive matters too.
Money held outside Bitcoin may help fund withdrawals during a difficult period and give a long-term Bitcoin position more time. The usefulness of that approach depends on the size of the reserve, other income and how long the difficult period lasts. In our second scenario, shares and bonds also fall, so their role needs to be considered carefully.
If your salary or business income also depends on the Bitcoin industry, consider whether that income could weaken at the same time as your investments. These calculations do not model employment or business income, but it belongs in the wider retirement plan.
You do not need to own 100% Bitcoin to express strong conviction in its long-term future. The question is how much exposure helps you build the retirement you want while leaving a workable way to pay for life along the way. Start with the income goal, explore the allocation and growth assumptions separately, then test whether the plan can withstand withdrawals and difficult markets.
Explore different Bitcoin allocations → Then read how to connect Bitcoin holdings with a retirement goal.
Calculation details and a summary chart
The figures retain the app calculation snapshot from 10 September 2026. The first table shows annual compound portfolio estimates from Portfolio Lab’s return and covariance model. Covariance describes how investments move together. The estimates are not a simple weighted average of the individual assets’ compound growth rates.
Bitcoin volatility stays at 42.5%, and the assumptions about how assets move together remain fixed. Other asset assumptions use the app’s USD reference inputs at the snapshot date. Changing the Bitcoin growth assumption does not change volatility or the separately specified market falls.
The second table applies each price change to the starting holdings. It does not simulate a recovery, subsequent rebalancing or a series of retirement withdrawals. Taxes, fees, inflation, currency changes and spending withdrawals are not included in these comparisons. The 0% to 20% Bitcoin allocation range is a comparison range, not a recommended limit or evidence that the right allocation must lie within it.
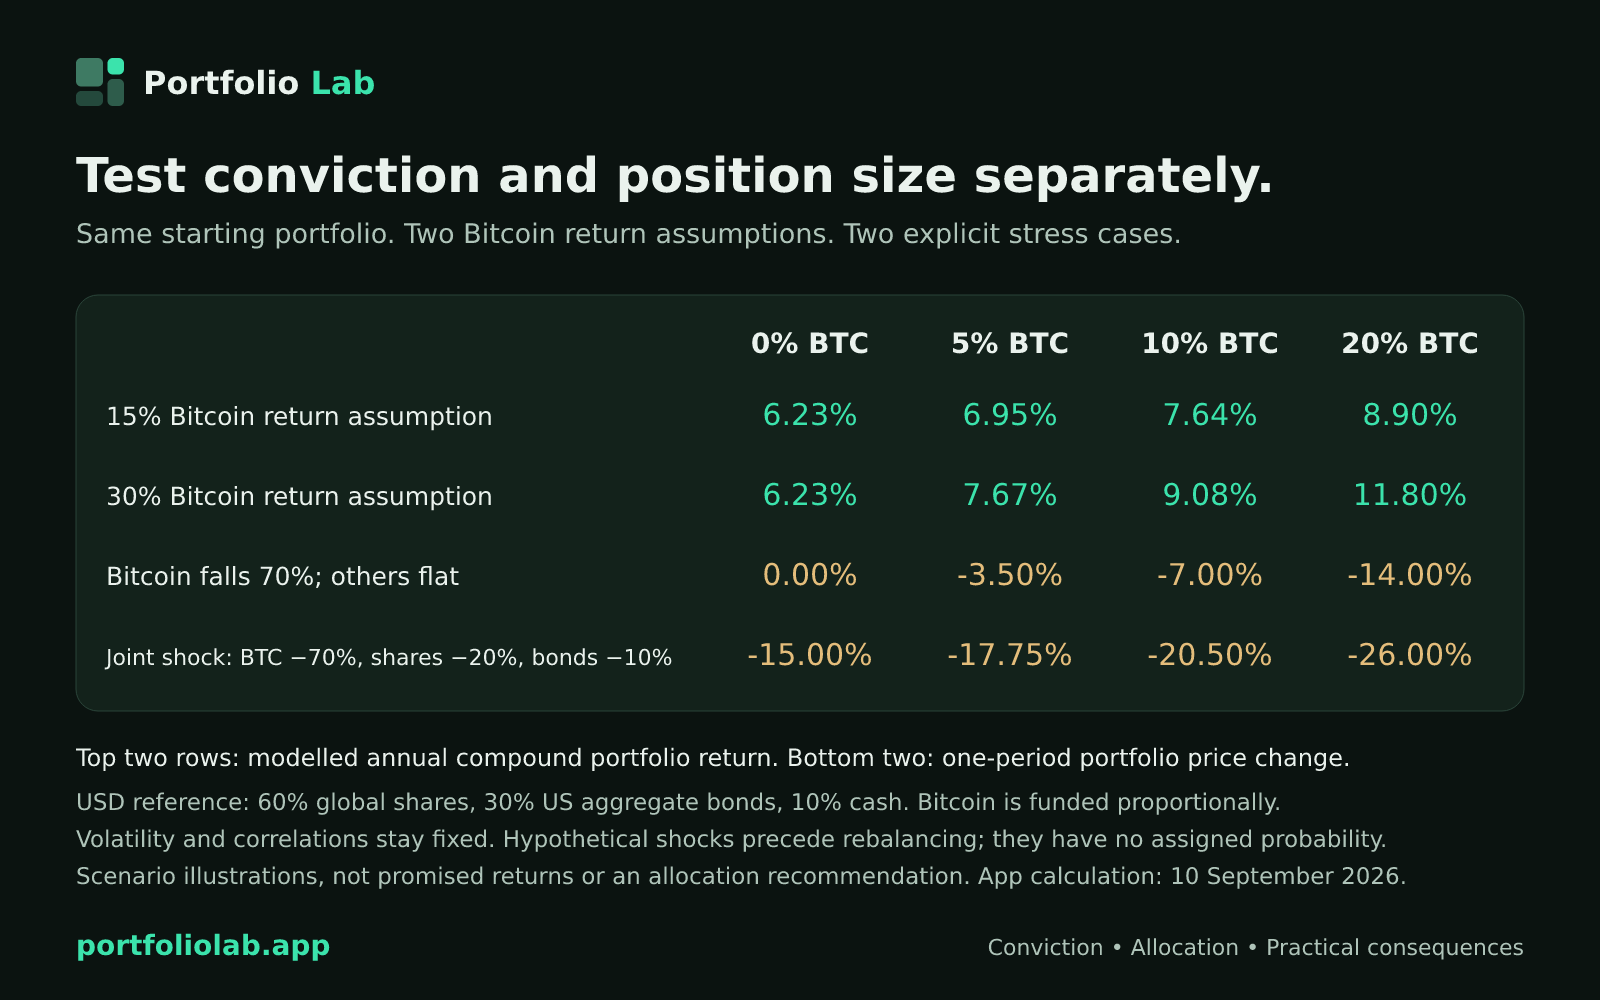
The live calculator can change as inputs are updated; the tables and chart retain their dated snapshot. You can download the calculation evidence or read how Bitcoin return assumptions are set.